1340 Madison Ave.
Memphis, TN 38104
Ph: (833) 462-8286


33 North Cleveland St.
Memphis, TN 38104
Ph: (901) 272-2308

130 Corporate Drive
Clarksville, TN 37040
Ph: (931) 266-0882

1033 Barfield Church Rd.
Murfreesboro, TN 37128
Ph: (615) 624-7878
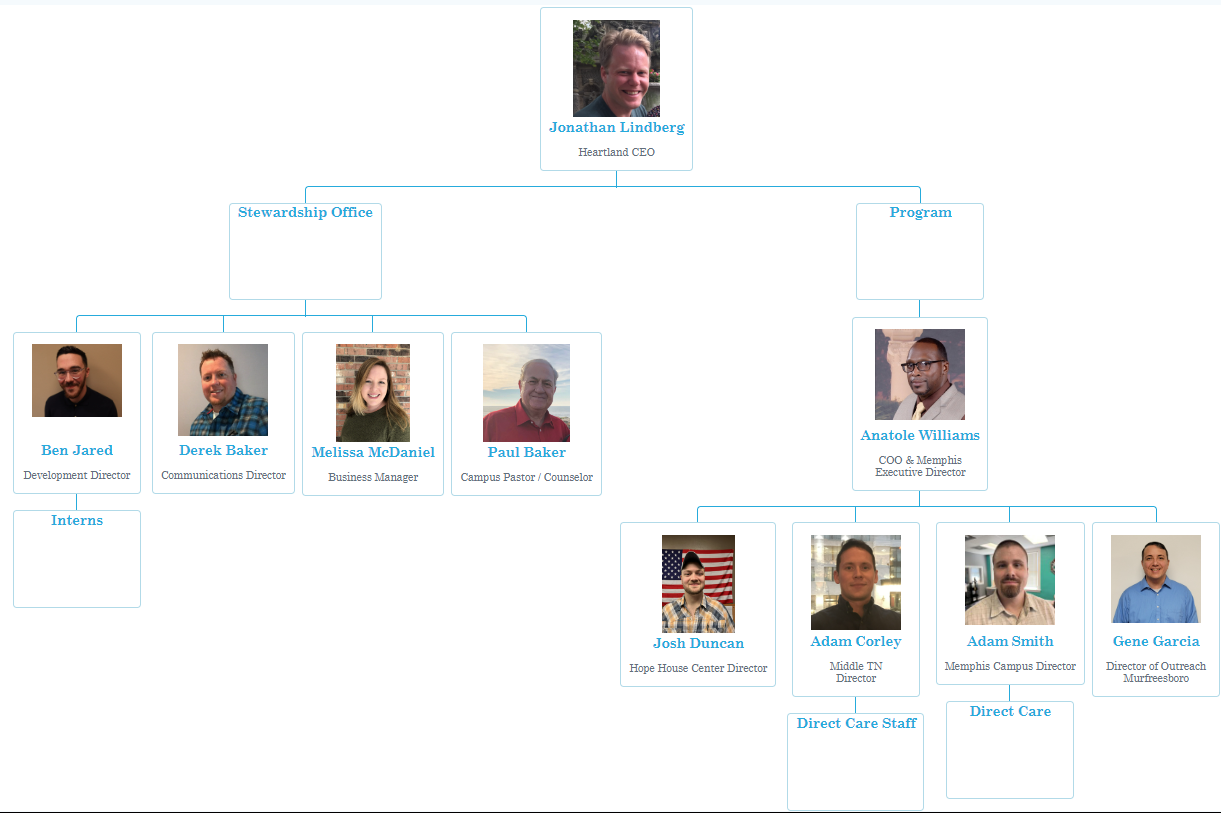
Organization Flow Chart
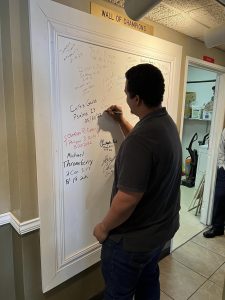
I now have Hope to be stronger and ready to face whatever challenges Life throws at me
ATCTN Student
Drug of Choice
Age of Students in the Program
18-25 Years Old
21%
26-35 Years Old
37%
36-45 Years Old
29.6%
46-55 Years Old
11.1%
56 + Years Old
1.2%
What Role did the program play in your first encounter with Christ?
I thought God was bad I thought God didn't want the best for me. But now I know God is so so so good!!!!
ATCTN Student

Where Students Are Referred From
Did you (do you intend to) sign up for a Missions Trip during your program?
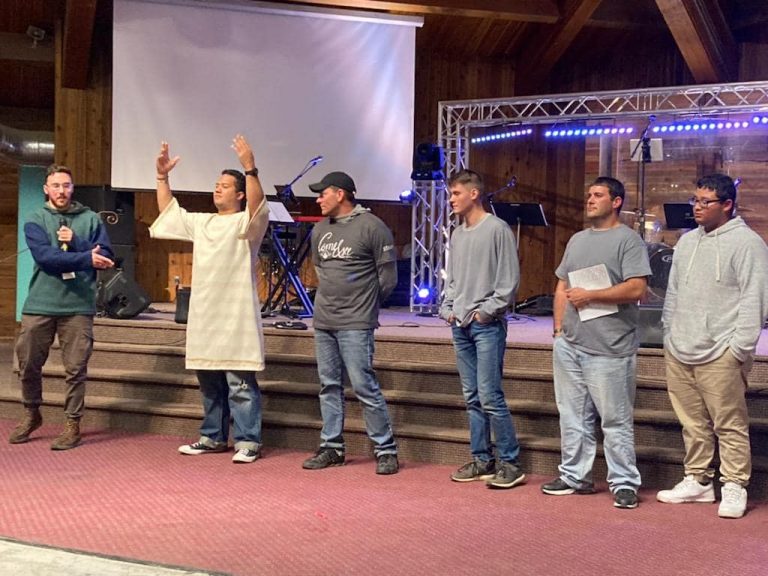
Now I believe with all my heart, mind, soul, that God is real and He sent His son Jesus Christ to save us. I have seen God work in my life as well as my other Brothers in Christ.
ATCTN Student
Which Phase of the Program was the most challenging
Locations of where the students come from
Average Days Of Students In or Out of Program
Students that Graduated Spent on Average
369 Days in the Program
Students that are currently In the Program Average
266 Days in the Program
Students that have been Dismissed spent on Average
216 Days in the Program
Students that Left the Program spent on Average
40 days in the Program
ATCTN Financial Data
Total Revenue & Expenses from 2017-2022
Where Revenue Comes From
Enterprise 2017 - 2022

Individual / Business Giving 2017 - 2022

Church Giving 2017 - 2022

Tuition/Student Funding 2017 - 2022

Fundraisers 2017 - 2022
Percentage of Total Revenue Generated by Enterprise and On Campus Revenue
2017
72%
2018
66%
2019
71%
2020
67%
2021
62%
2022
65%
Revenue Growth from Previous year 2012-2021
2013 -3.3%
2014 +25.8%
2015 -2.2%
2016 +8.1%
2017 +18.8%
2018 -3.7%
2019 +7.8%
2020 +10.6%
2021 +17%
2022 -2.1%

